All Case Studies

Fin-Tech · Healthcare · Non-Profit

Fresh Connect

Analytics & reporting for a HIPAA-compliant food prescription platform — designed to scale from regional pilot to national expansion.

My Role

Lead Product Designer

Team

Director of Product, Product Manager,
Two External Dev Teams

Focus

Dashboard Design · Data Visualization
Reporting UX · Design Systems

A food prescription platform facing rapid national scale

Fresh Connect was a 3-year-old, HIPAA-compliant, tech-enabled food prescription program empowering patients with the money and flexibility to buy the foods they need to be healthy. Its web app platform allowed healthcare partners and providers to enroll cardholders, manage financials, and provide cardholder success to patients.

A planned nation-wide expansion — including new retailers and an estimated quadrupling of cardholders in a single year — created an urgent need for expanded, automated reporting tools. Much of the reporting was being done ad hoc, by hand.

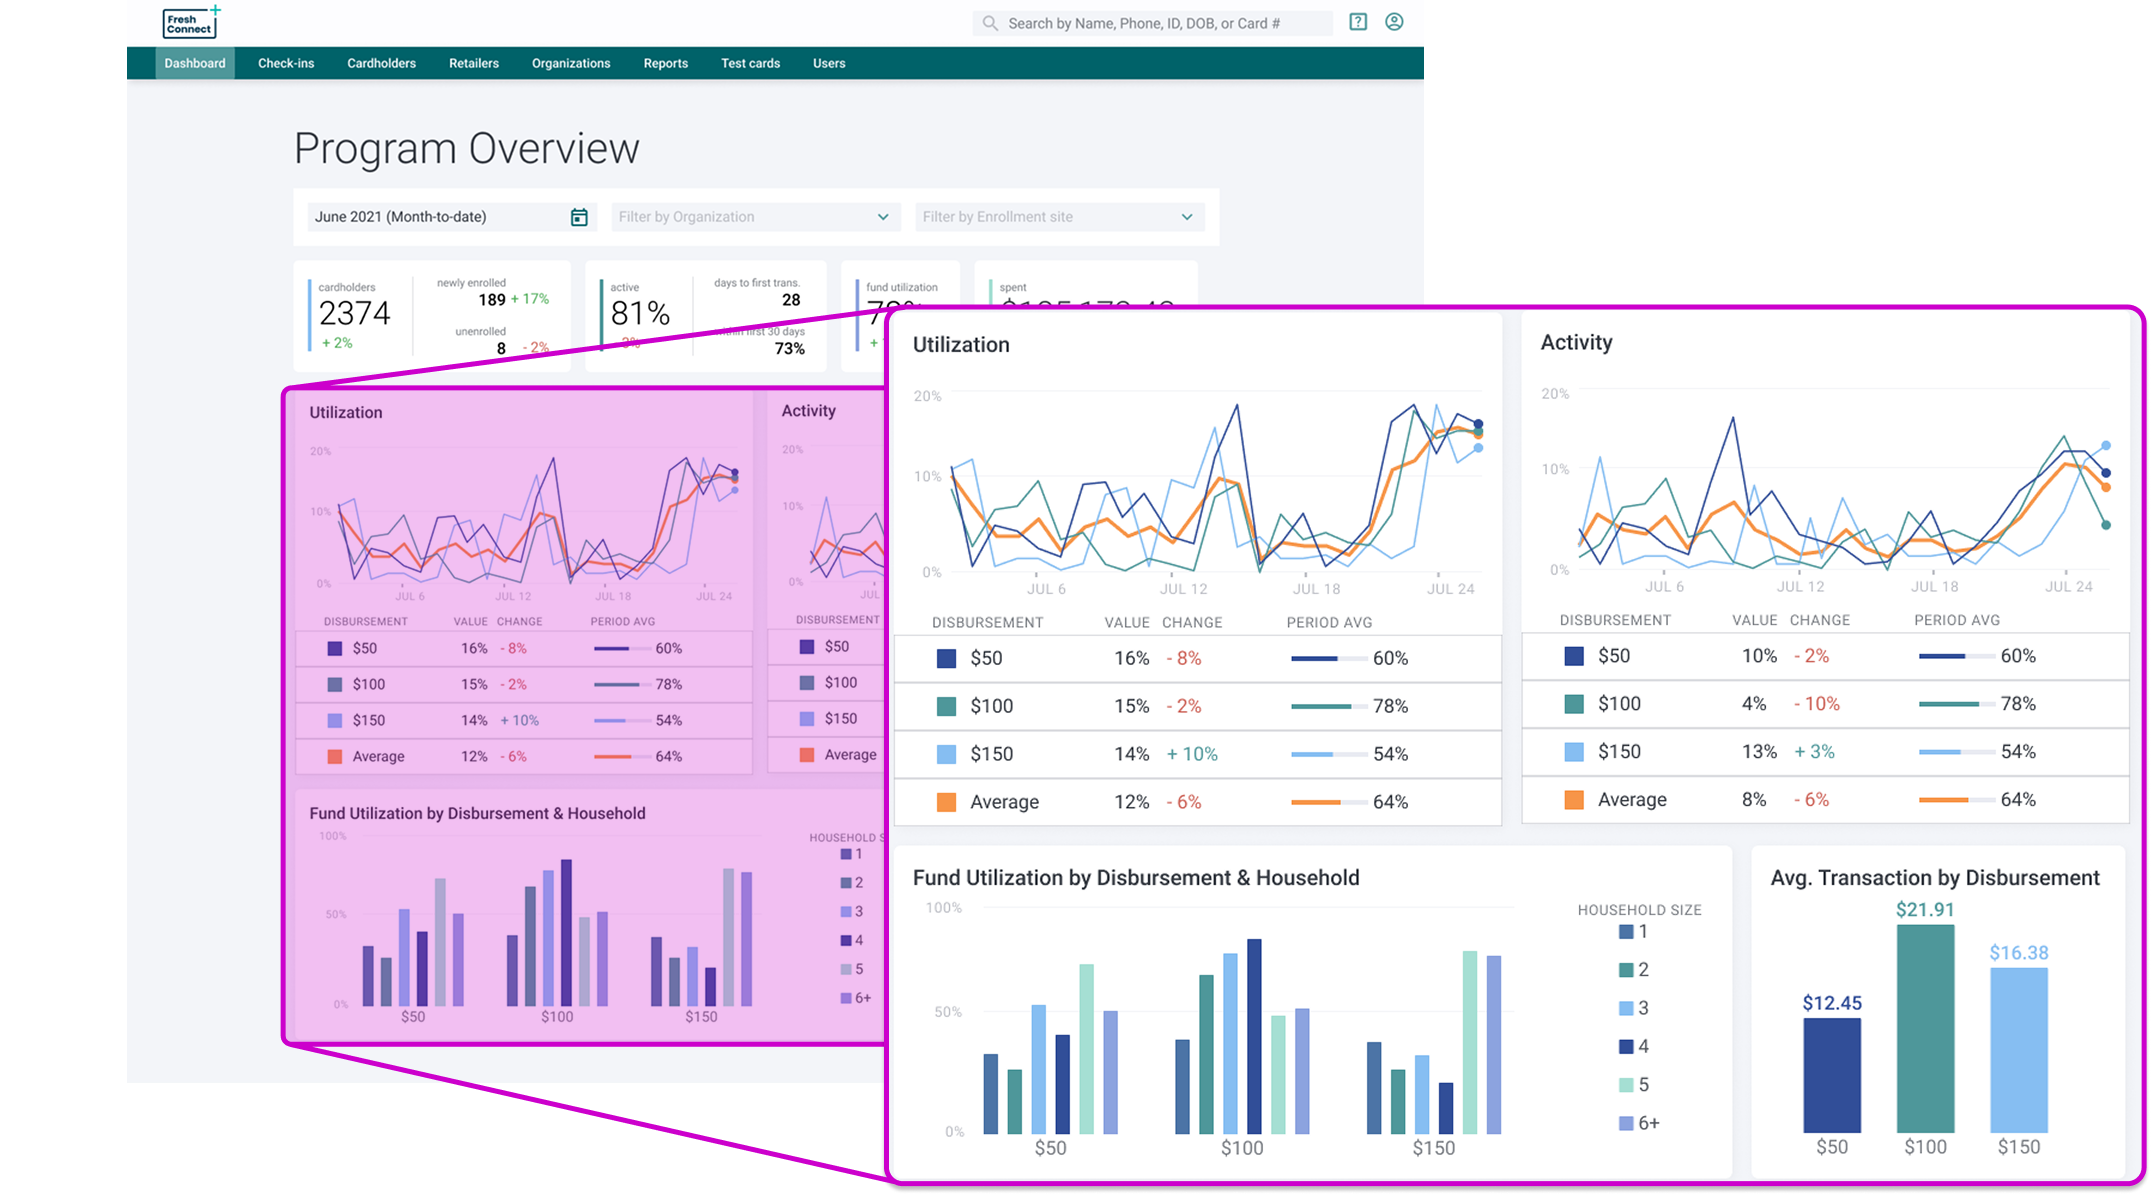
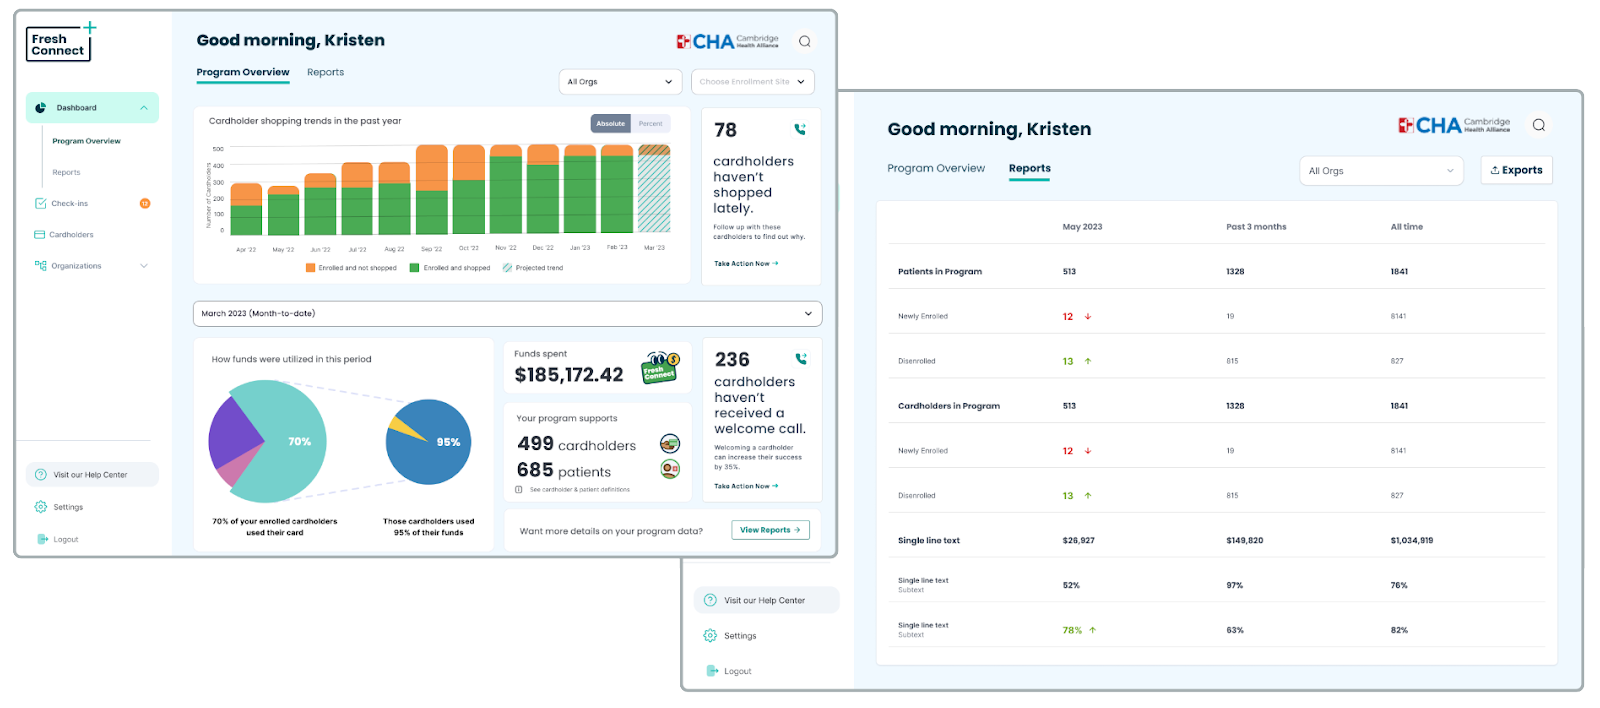
The existing dashboard had become inaccurate due to lagging data updates. It had to be pulled down entirely and revamped before the expansion could proceed.

Three core problems needed solving:

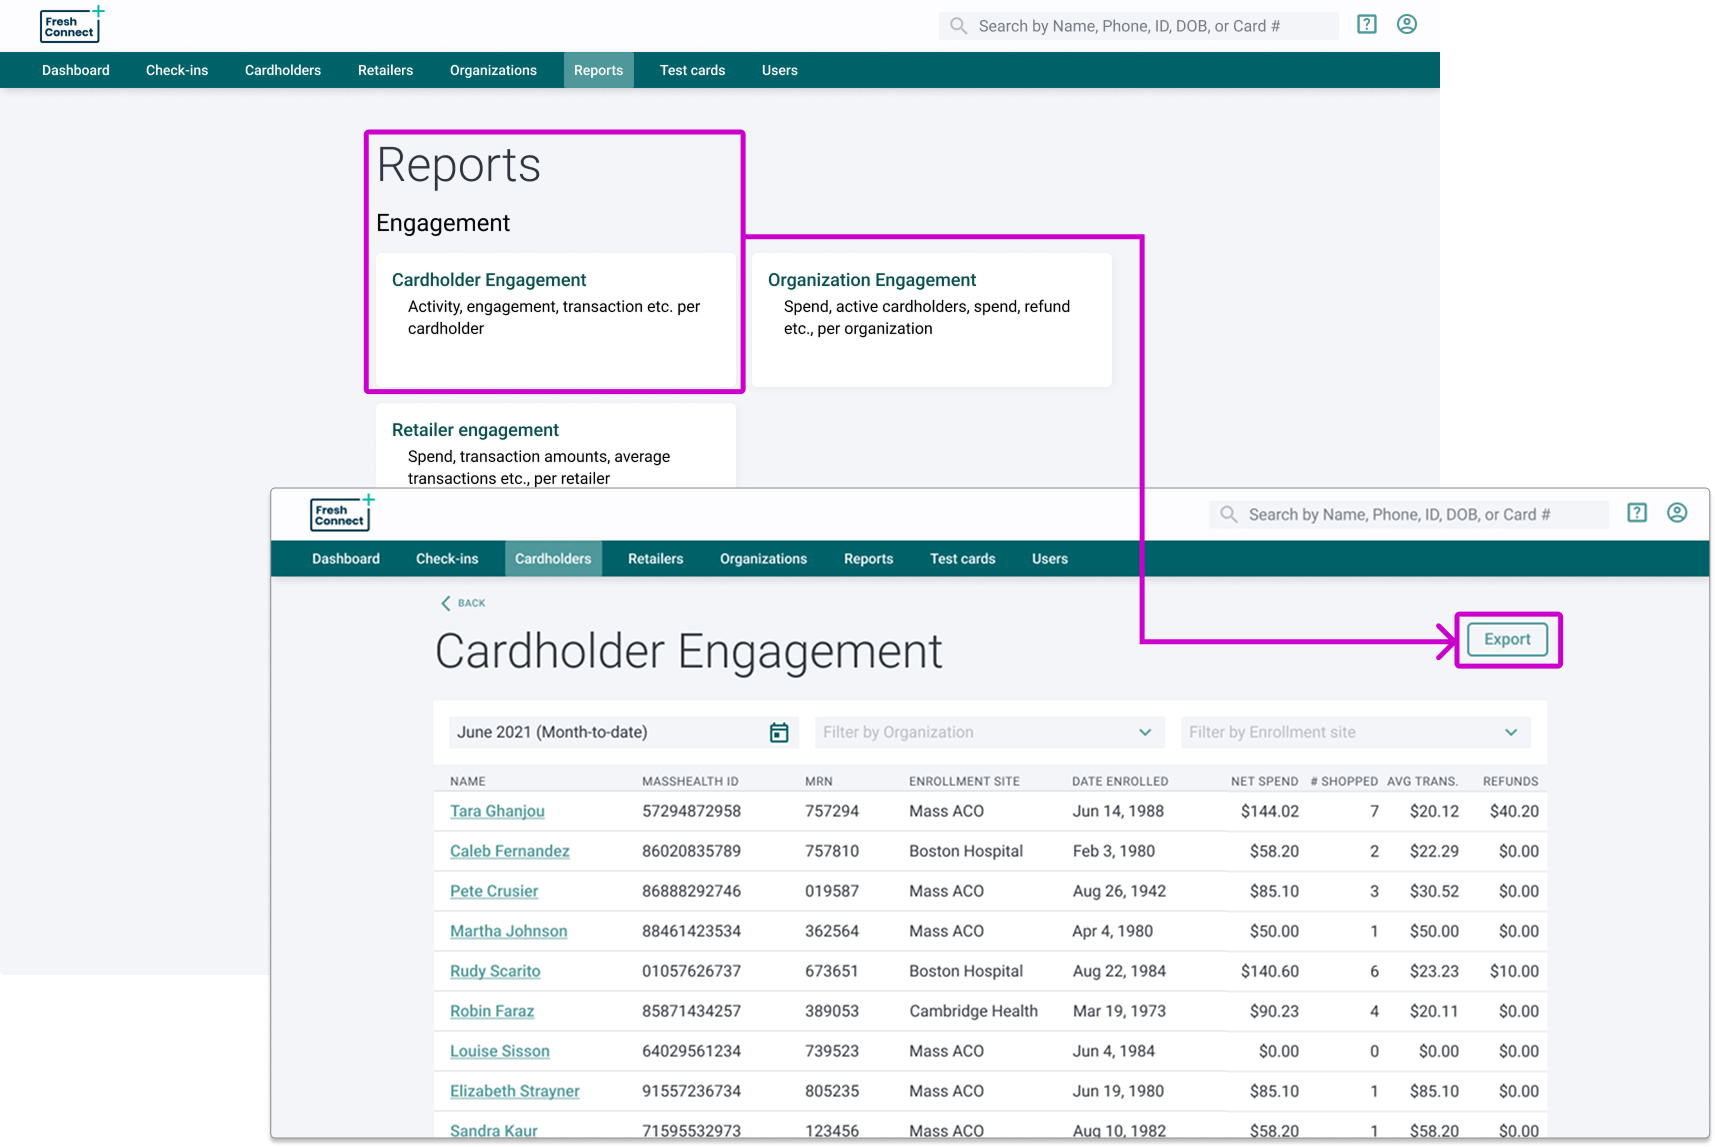
Running cardholder engagement reports was the top user task, but was buried under many clicks — and multiple report types existed that users rarely found useful.

Users were forced to sort and filter data manually in Excel to fully run reports, adding friction and error risk.

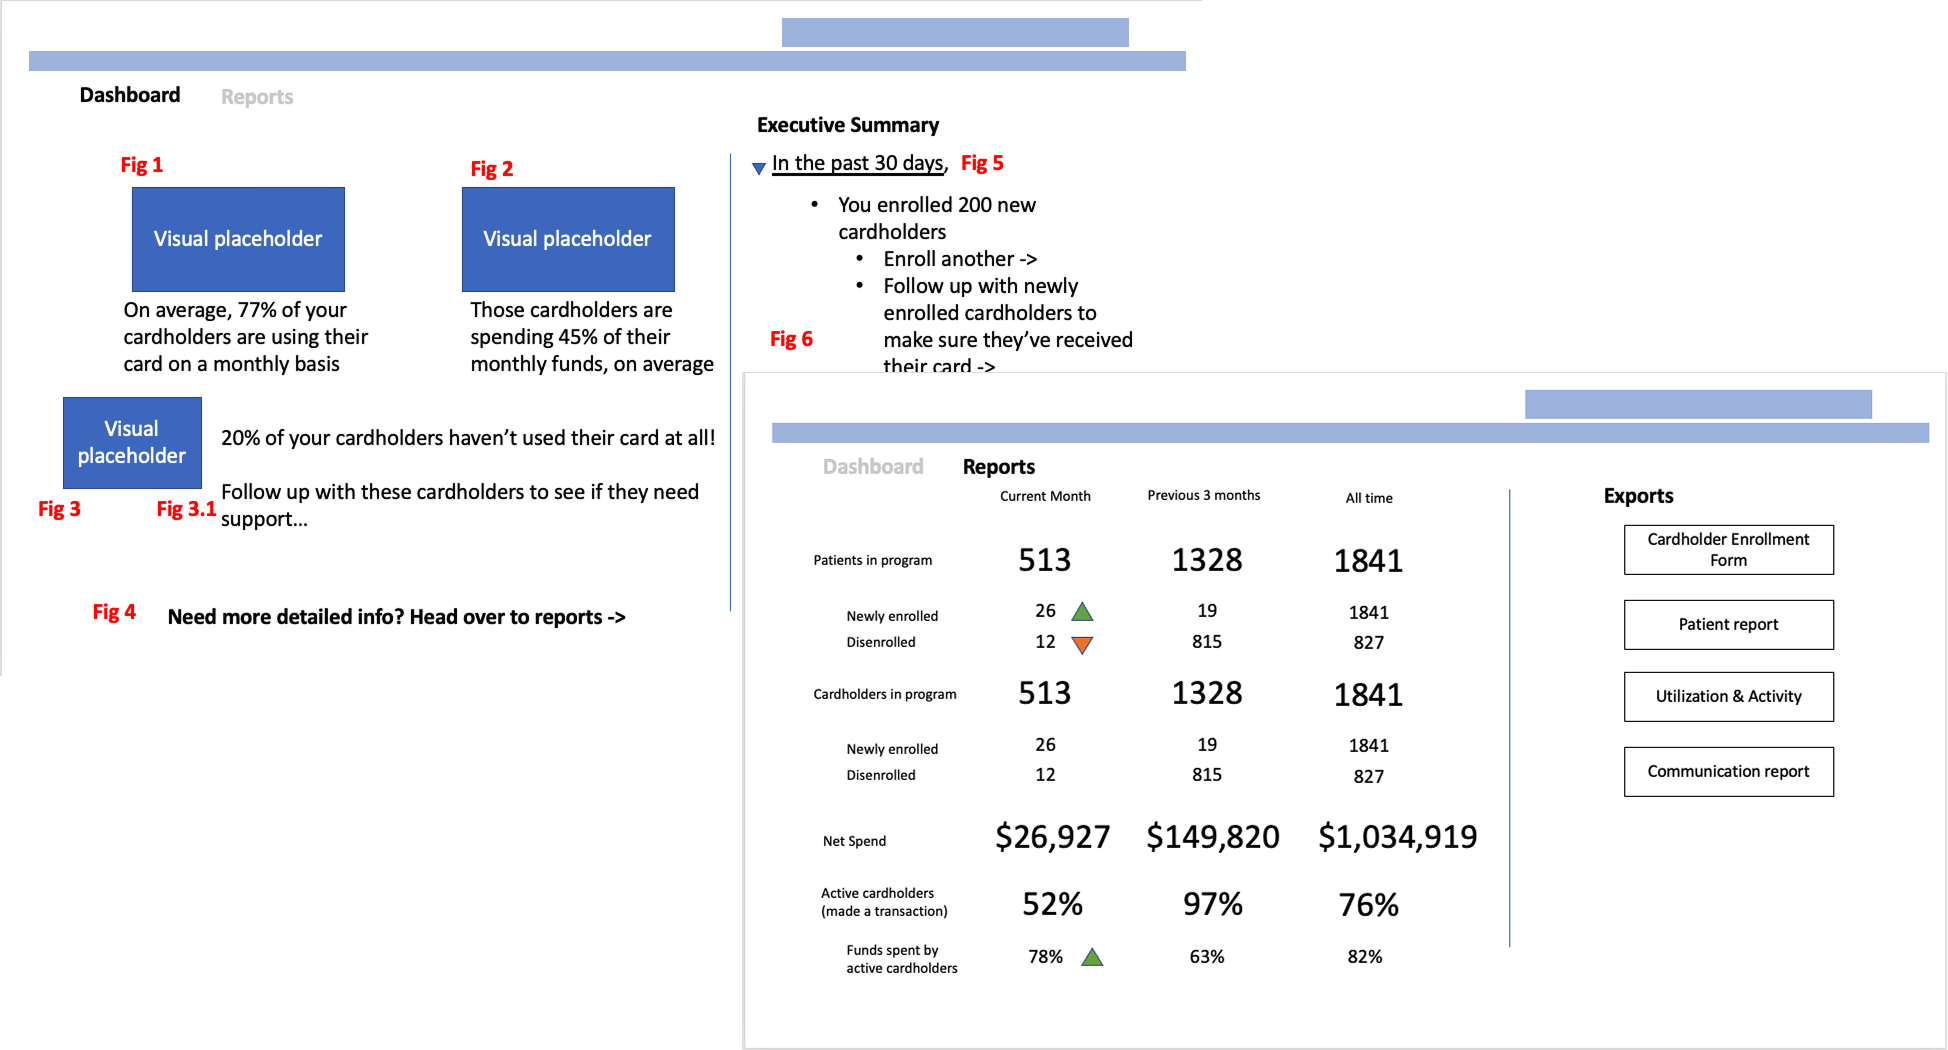
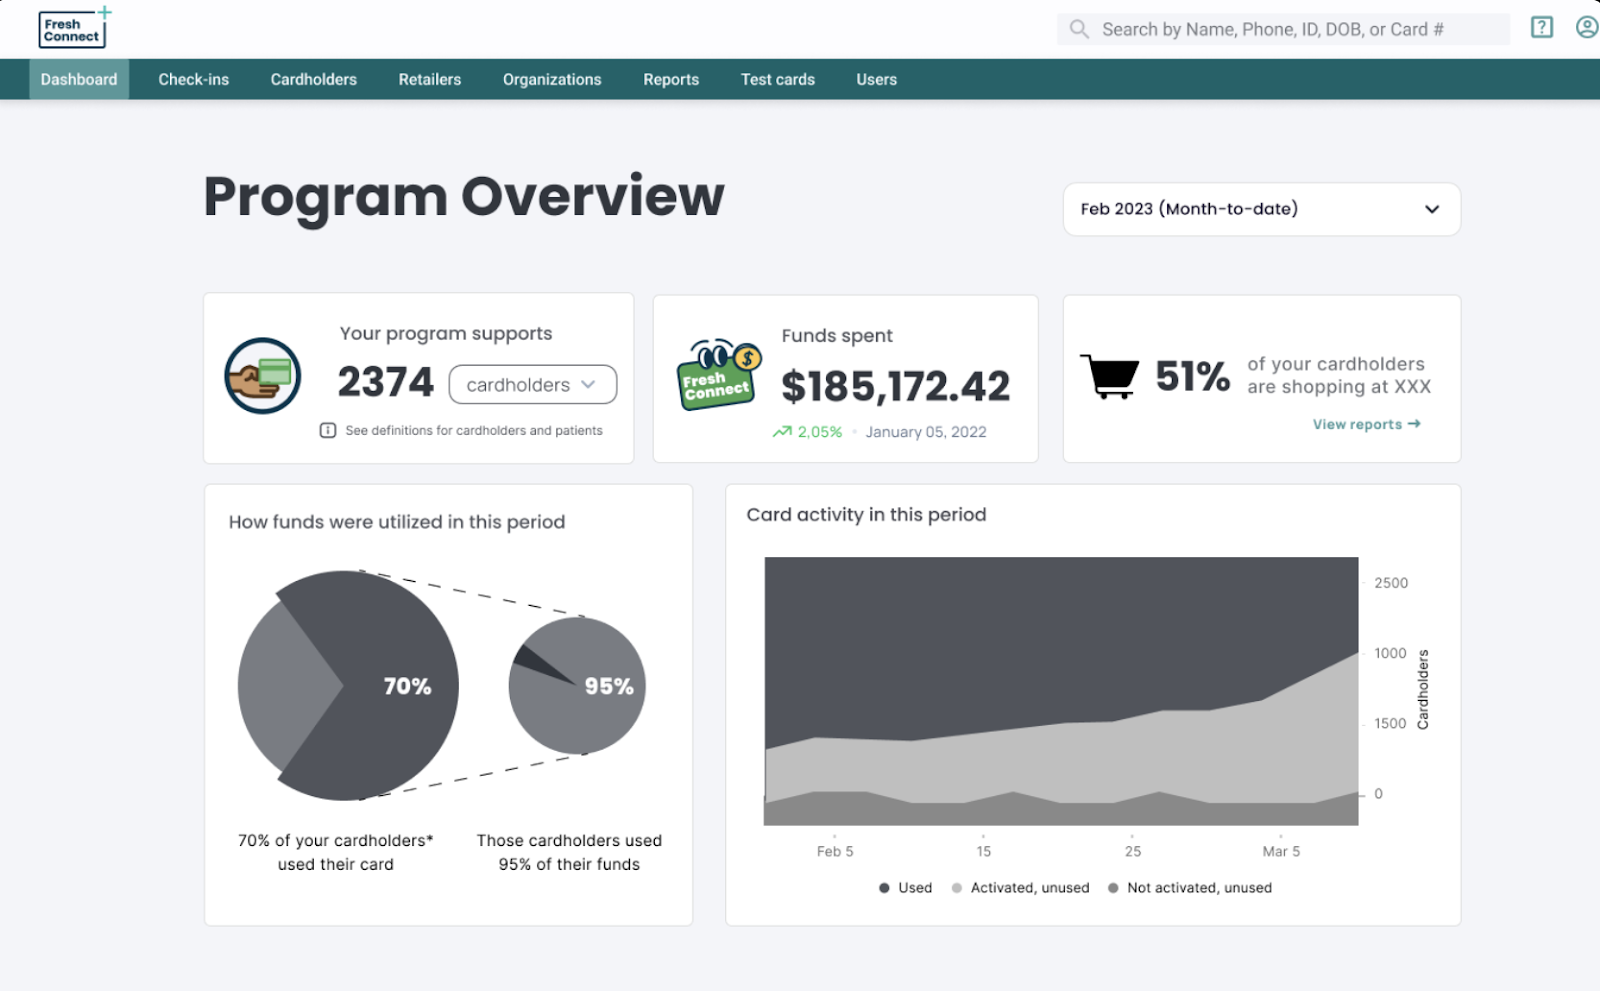
No high-level dashboard existed to proactively answer key program health questions — users had to hunt for answers.

Fresh Connect Program Overview dashboard showing utilization and activity metrics Fresh Connect Reports and Cardholder Engagement export view

From paper sketches to a stakeholder-ready prototype

As Lead Product Designer, I owned the end-to-end design process — from initial research synthesis through prototyping, user testing, and developer handoff. The Director of Product captured a month's worth of inbound customer requests while the dashboard was offline, giving us a rich qualitative foundation to design against.

Research

Customer request synthesis

One month of inbound requests captured by the Director of Product, supplemented by heuristic evaluation and UX auditing of the existing platform.

Exploration

Multi-fidelity sketching

Sketched extensively on paper, in Figma, and in PowerPoint — iterating toward a narrative, actionable dashboard concept before committing to pixels.

Testing

Grayscale prototype testing

Used intentionally colorless graphs in the first test round to focus user feedback on data story and hierarchy — not aesthetics. Ran standardized sessions with 3 customers and 3 internal stakeholders.

Iteration

Stakeholder-driven refinement

Multiple design review rounds with internal stakeholders and developers narrowed widget scope and sharpened the interaction model before final handoff.

Early PowerPoint sketches of the Fresh Connect dashboard and reports layout

Designing for the data story, not the data dump

User testing surfaced clear direction: people needed both percentages and absolute numbers in context, they wanted baselines to understand performance, and the two most critical metrics were Shopping Activity and Fund Utilization.

Surface the right report first. Restructured the reporting IA to bring cardholder engagement reports — the top user task — front and center, removing the multi-click journey entirely.

Pair percentages with absolutes. Research showed users couldn't make decisions from percentages alone. Every key metric was redesigned to show both the relative and absolute figure in context.

Baseline comparisons as a core pattern. Users consistently asked "are we performing well?" — so baseline reference lines and period-over-period comparisons became a first-class design element throughout the dashboard.

Grayscale-first prototype testing. A deliberate choice to strip color from the first round of testing kept feedback focused on whether the data story was being told correctly — before aesthetics entered the conversation.

Fresh Connect Program Overview dashboard final design

The final prototype was used in all-hands presentations for internal awareness, and in sales & fundraising demos — demonstrating the value of a well-crafted design artifact beyond just engineering handoff.

A functional foundation built to scale

A mid-project discovery — data loss when onboarding a new external development team — required the team to find a pragmatic path forward. Despite this setback, the redesign delivered meaningful progress and laid the groundwork for future iteration.

Actionable dashboard

The new dashboard contained directly actionable items, replacing a static and inaccurate legacy view.

Partner personalization

Co-branding and partner personalization features became immediately achievable on the new foundation.

Bespoke design system

A new, updated design system was established during this project — setting a consistent visual language for all future iterations.

Fresh Connect final dashboard design with program overview and reports

Next Case Study

Mapped